FREE REACTION TEST
Reaction Time Test: Check Your Reflex Speed Online
Want to know how fast your reflexes are? This free reaction time test measures your response speed in milliseconds using visual, audio, and touch cues. Get detailed stats, compare your performance, and track improvements over time.
Percentile
—
False starts
0
World avg
273 ms
Attempts
0
Age comparison
What Does This Tool Do?
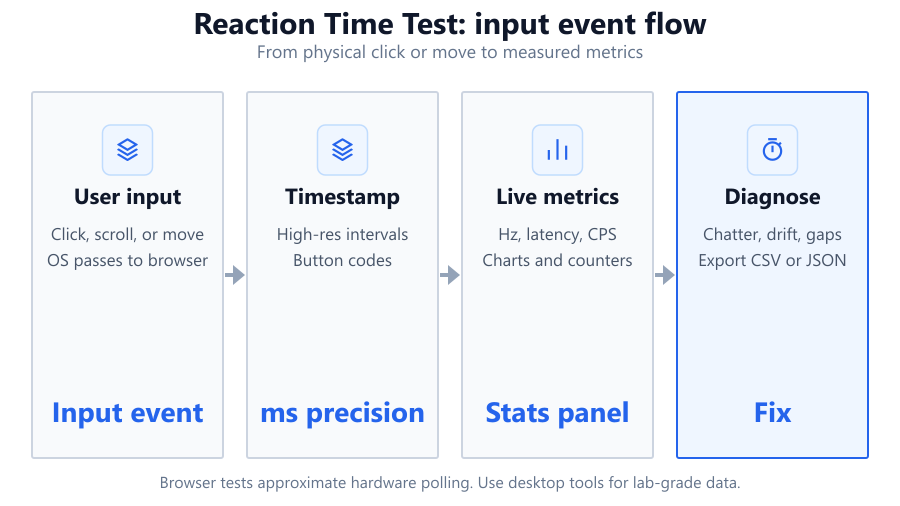
This browser-based reaction time test measures how quickly you respond to different signals: visual, audio, touch, or spacebar input. After a random delay between 1.5 and 4 seconds, the tool prompts you to react as soon as possible. It records your reaction time in milliseconds, logs each attempt, and shows your last, best, average, and median scores. The tool also displays your percentile ranking, age group comparison, a world average reference, and assigns a performance tier badge. Track your progress with a trend chart and export session data for later review. All data is processed live in your browser with secure random delays and false-start detection, so you can trust your results within the limits of browser testing.
How to Use This Tool
Choose your preferred mode: visual (color change), audio (beep), spacebar, or touch (useful for mobile and tablets). Click 'Start' to begin. After a short random delay, the screen turns green or you hear a sound. Click, tap, or press the spacebar as fast as you can once you see or hear the go signal. If you react too early, the tool detects a false start and restarts the round. Each attempt is logged in milliseconds. Use the export feature to save your session data. Stats and charts update live in the sidebar, so you can see how your performance changes. For best results, test multiple times and use the same device and browser.
Understanding Your Results
Your main result is your reaction time in milliseconds. Lower numbers mean faster reflexes. The tool displays your last, best, average, and median times. Percentile ranking shows how your score compares to other users. The age group comparison chart helps you see if your reflexes are typical for your demographic. The world average reference puts your performance in context. A performance tier badge quickly shows if you’re in a top, average, or below-average group based on your results. The trend chart visualizes your consistency and improvements over multiple attempts. Export your results for personal tracking or sharing.
Common Problems This Helps Diagnose
Slow or inconsistent reaction times can be influenced by hardware, software, or personal factors. This tool helps identify lag caused by high input latency, slow monitors, or unresponsive peripherals. Gamers can use it to spot issues like slow mouse polling rates or keyboard debounce delays, especially with gear like the Logitech G Pro X Superlight or Corsair K70 RGB. Office users can check for sluggishness on older Dell monitors or wireless mice. It can also highlight the impact of browser settings, background processes, or accessibility features that might slow down input. If you notice big differences between modes or devices, it could point to hardware bottlenecks or OS-level input lag.
Examples and Scenarios
Scenario 1: Competitive Gamer A Valorant player uses the tool to benchmark their reaction speed on a 240 Hz Alienware AW2521H monitor with a Logitech G Pro X Superlight mouse. They test in visual and audio modes. Their average is 155 ms, in the top 5 percent. They export the session and compare it to past results after switching to a new mousepad.
Scenario 2: Office User Troubleshooting Mouse Lag A Dell Latitude laptop user with a low-cost wireless mouse suspects lag during Zoom calls. Using the visual mode, they get inconsistent results, with reaction times swinging from 210 ms to 350 ms. They switch to a wired Logitech M500 and see steadier scores around 200 ms, confirming wireless interference.
Scenario 3: Touchscreen Reflexes on Mobile A student with an iPad Air tests reaction time in touch mode. Their average is 180 ms, slightly above the world average. They notice improvement after turning off accessibility features like AssistiveTouch, dropping their median time to 170 ms.
Scenario 4: Comparing Audio vs Visual Cues A streamer with a Corsair K70 keyboard tries both audio and visual modes. Their audio reaction times are consistently 15 ms faster than visual, showing they respond quicker to sound. They use the session export to analyze the difference over 50 trials.
Scenario 5: Age Group Comparison for Training A 55-year-old uses the tool’s age group comparison to see how they stack up against others in their bracket. Their 220 ms average puts them at the 70th percentile for their age, suggesting their reflexes are above average. They plan regular sessions to maintain cognitive sharpness.
Scenario 6: Diagnosing Monitor Response Time A PC builder tests two monitors: a Dell S2721DGF (165 Hz) and a generic 60 Hz panel. Reaction times are 175 ms on the Dell and 210 ms on the 60 Hz. The clear gap points to higher input latency on the cheaper monitor.
Tips for Accurate Testing
Close unnecessary browser tabs and background apps to reduce input lag. Use a wired mouse or keyboard for best accuracy. Test on a high-refresh-rate monitor if possible. Calibrate your display and disable OS features like mouse acceleration or sticky keys. For touchscreens, clean the surface and avoid screen protectors that can delay input. Stick to the same browser and device for consistent results, as Chrome, Firefox, and Edge may process input differently. Avoid Wi-Fi interference if using wireless peripherals. Run multiple trials to get a reliable average and watch for outliers. Remember, browser-based tests have small timing inaccuracies due to browser polling and refresh rates, so use dedicated software or hardware timers for lab-grade precision.
Browser vs Desktop Software
Browser-based reaction time tests are convenient and accessible on any device. However, they are limited by browser timing, OS scheduling, and device input polling rates. For example, the fastest browsers still rely on animation frames and event listeners that can introduce a few milliseconds of jitter. Mouse and keyboard events may be delayed by system background tasks or power-saving features. Desktop software like Human Benchmark, RT Test, or dedicated hardware (like the Monolyth Input Lag Tester) can achieve tighter timing accuracy, especially when paired with high-end gear like the Razer Viper 8K or Asus ROG Swift monitors. Use browser-based tools for quick checks or trend tracking, but rely on specialized software for esports or scientific testing.
Summary
This reaction time test provides a fast, free way to measure your reflexes using your browser. It tracks your speed in milliseconds, logs every attempt, and gives you context with age group and world averages. With multiple modes, trend charts, and export options, it’s a versatile tool for gamers, office users, students, and anyone interested in cognitive performance. While browser limitations mean it’s not lab-accurate, it’s more than enough for personal benchmarking and troubleshooting. For the best results, pay attention to your hardware and software environment, and use dedicated tools for precise professional needs.
Frequently Asked Questions
How accurate is this online reaction time test compared to lab equipment?
Browser-based reaction time tests are accurate enough for everyday benchmarking but cannot match the precision of dedicated lab equipment. Timing is affected by browser rendering, OS scheduling, and input polling rates. Results may vary by a few milliseconds due to these factors. For most users, this margin is negligible, but for scientific or esports-grade testing, hardware timers or pro-grade software are recommended. Use this tool for casual comparison, not for clinical or research purposes.
What is a good reaction time for gaming?
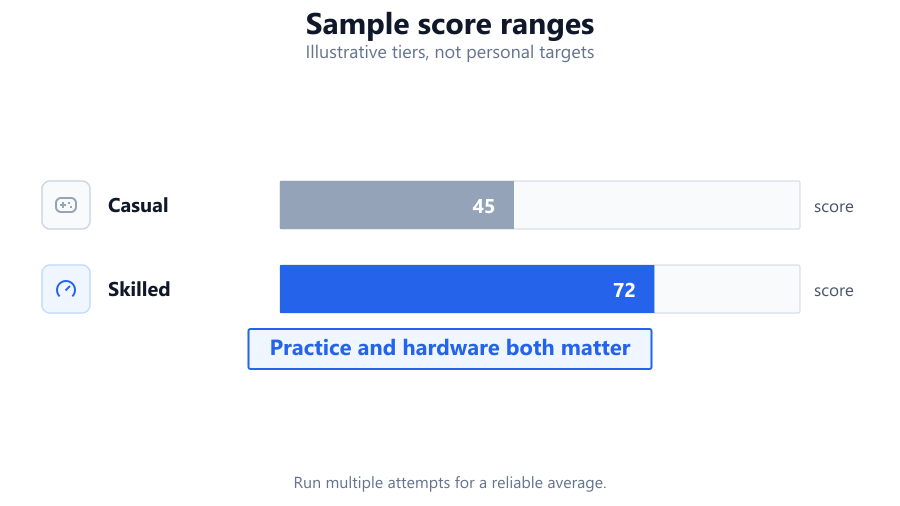
A good reaction time for gaming is generally between 150 ms and 200 ms. Esports players often average 130-160 ms in controlled environments with high-end gear like the Logitech G Pro X Superlight and 240 Hz monitors. Most casual gamers land in the 180-220 ms range. Anything below 200 ms is considered quick. If you consistently score above 250 ms, consider checking your hardware and settings for input lag.
Why do my results change between devices or browsers?
Different devices and browsers handle input events and rendering at different speeds. For example, Chrome and Firefox may process clicks or keypresses with slightly different delays. Touchscreens have their own latency, and wireless peripherals can introduce extra lag. Even power-saving features or background apps can affect results. For consistent benchmarking, always use the same device, browser, and hardware setup.
Can this reaction time test detect hardware lag or input latency?
Yes, it can help identify hardware lag if you see slower or inconsistent reaction times, especially when switching between peripherals. For example, testing with a wired Corsair K70 keyboard versus a wireless model can expose input delays. However, it won’t isolate the exact cause. For detailed latency measurement, specialized tools or hardware testers are more accurate.
Does monitor refresh rate affect reaction time test results?
Yes, higher refresh rates can lower perceived input lag and improve reaction time scores. Monitors like the Alienware AW2521H (240 Hz) or Dell S2721DGF (165 Hz) provide smoother, faster feedback than standard 60 Hz displays. Lower refresh rates can introduce delay, making your reaction times appear slower by up to 8-16 ms or more, depending on the panel and settings.
How does the random delay work in this tool?
The tool uses a secure random number generator to select a delay between 1.5 and 4 seconds before triggering the signal. This prevents you from predicting when to react, ensuring your response is genuine. Secure randomness adds fairness by making the timing unpredictable on every attempt.
Why do I get a false start warning?
A false start is detected if you click, tap, or press the spacebar before the signal. This ensures only true reaction times are counted and stops users from 'gaming' the test by guessing. If you get frequent false starts, try relaxing and waiting for the actual cue, or check for hardware issues like sticky keys or oversensitive mice.
What do average, median, and percentile mean in my results?
Average is your total reaction time divided by the number of attempts, showing your typical speed. Median is the middle value, less affected by outliers, and gives a better sense of your consistent performance. Percentile tells you how your score compares to other users; for example, the 80th percentile means you’re faster than 80 percent of people who took the test.
Can I use this reaction time test on my phone or tablet?
Yes, the tool supports touch mode, making it easy to test on smartphones and tablets like iPads or Android devices. Just tap the screen when prompted. Results may differ slightly from desktop due to touchscreen latency, but it’s a good way to benchmark mobile reflexes or compare devices.
Is it possible to improve my reaction time with practice?
Yes, regular practice can help sharpen your reflexes. By repeating the test and tracking your progress, you can train your brain and muscles to respond quicker. Gamers, athletes, and drivers often use similar drills. Just keep in mind that improvement plateaus over time, and factors like fatigue, stress, or distraction will affect your scores.
What factors outside hardware can slow my reaction times?
Physical and environmental factors include fatigue, hunger, dehydration, stress, distractions, and even lighting conditions. Medications or health conditions can also play a role. Make sure you’re well-rested and focused when testing, and avoid testing under poor or changing conditions for the most accurate results.
Does the tool support exporting or sharing my results?
Yes, after your session you can export your attempt history and stats. This is especially useful for tracking long-term progress or sharing with friends, coaches, or on social media. The export includes all recorded times, averages, and trend data, so you can analyze or compare later.
How does this tool compare to Human Benchmark?
Both tools offer similar core functionality: measuring reaction time in milliseconds with visual cues. This tool adds audio, touch, and spacebar modes, plus deeper stats like age group comparison, percentile rank, and trend charts. Human Benchmark is widely used but may lack some advanced features and export options found here. Both are browser-based, so their accuracy is comparable.
Can browser extensions or OS settings affect my results?
Yes, browser extensions that alter page behavior, block scripts, or inject overlays can disrupt timing or input detection. OS features like mouse acceleration, sticky keys, or accessibility options can also introduce delays. For clean results, test in a fresh browser profile with minimal extensions and standard OS settings.
Should I use a wired or wireless mouse for best results?
A wired mouse generally provides lower latency and more consistent reaction times. Wireless mice, especially older or non-gaming models, can add 10-20 ms of delay due to signal processing and interference. High-end wireless models like the Logitech G Pro X Superlight minimize this gap, but for absolute best scores, wired is still preferred.
How can I interpret the performance tier badge?
The performance tier badge quickly summarizes your overall score based on your average reaction time. Top-tier means your reflexes are faster than most users, middle tiers are average, and lower tiers indicate slower-than-average response. It’s a visual shortcut to help you gauge your standing at a glance, especially when comparing multiple sessions.
Related Tools
Free tools to analyze, compare, and optimize your PC gaming performance
Mouse Latency Test
Measure mouse input latency, click latency, jitter and response consistency directly in your browser.
Use Tool →Keyboard Latency Test
Measure keyboard input latency, event timing, jitter and response consistency online.
Use Tool →CPS Test
Measure your clicks per second with customizable test durations, live tracking and detailed statistics.
Use Tool →APM Test
Measure your actions per minute, accuracy and speed using interactive target-based challenges.
Use Tool →Popular Game System Requirements
Check if your PC meets the requirements for these popular games
Benchmark data from PassMark and publisher specs. Calculators run locally in your browser — we never upload your hardware info.